Connecting BigQuery to Looker Studio: Complete Setup Guide
BigQuery is one of the most powerful data sources for Looker Studio dashboards. With the ability to query petabytes of data in seconds, it’s the go-to choice for enterprise analytics. In this guide, I’ll show you exactly how to connect BigQuery to Looker Studio, including advanced techniques I’ve refined over 8 years of building production dashboards.
Why Use BigQuery with Looker Studio?
Before we dive into the setup, here’s why BigQuery + Looker Studio is a powerful combination:
- Speed - Query billions of rows in seconds
- Scale - Handle massive datasets without performance issues
- Cost-effective - Pay only for what you query
- Real-time - Access live data, not stale exports
- SQL power - Use full SQL capabilities in your dashboards
Prerequisites
Before starting, ensure you have:
- A Google Cloud Platform (GCP) account
- A BigQuery dataset with data
- Appropriate permissions (BigQuery Data Viewer at minimum)
- A Looker Studio account (same Google account recommended)
Method 1: Direct Table Connection (Simplest)
This is the fastest way to connect a BigQuery table to Looker Studio.
Step 1: Create a New Report
- Go to lookerstudio.google.com
- Click Create → Report
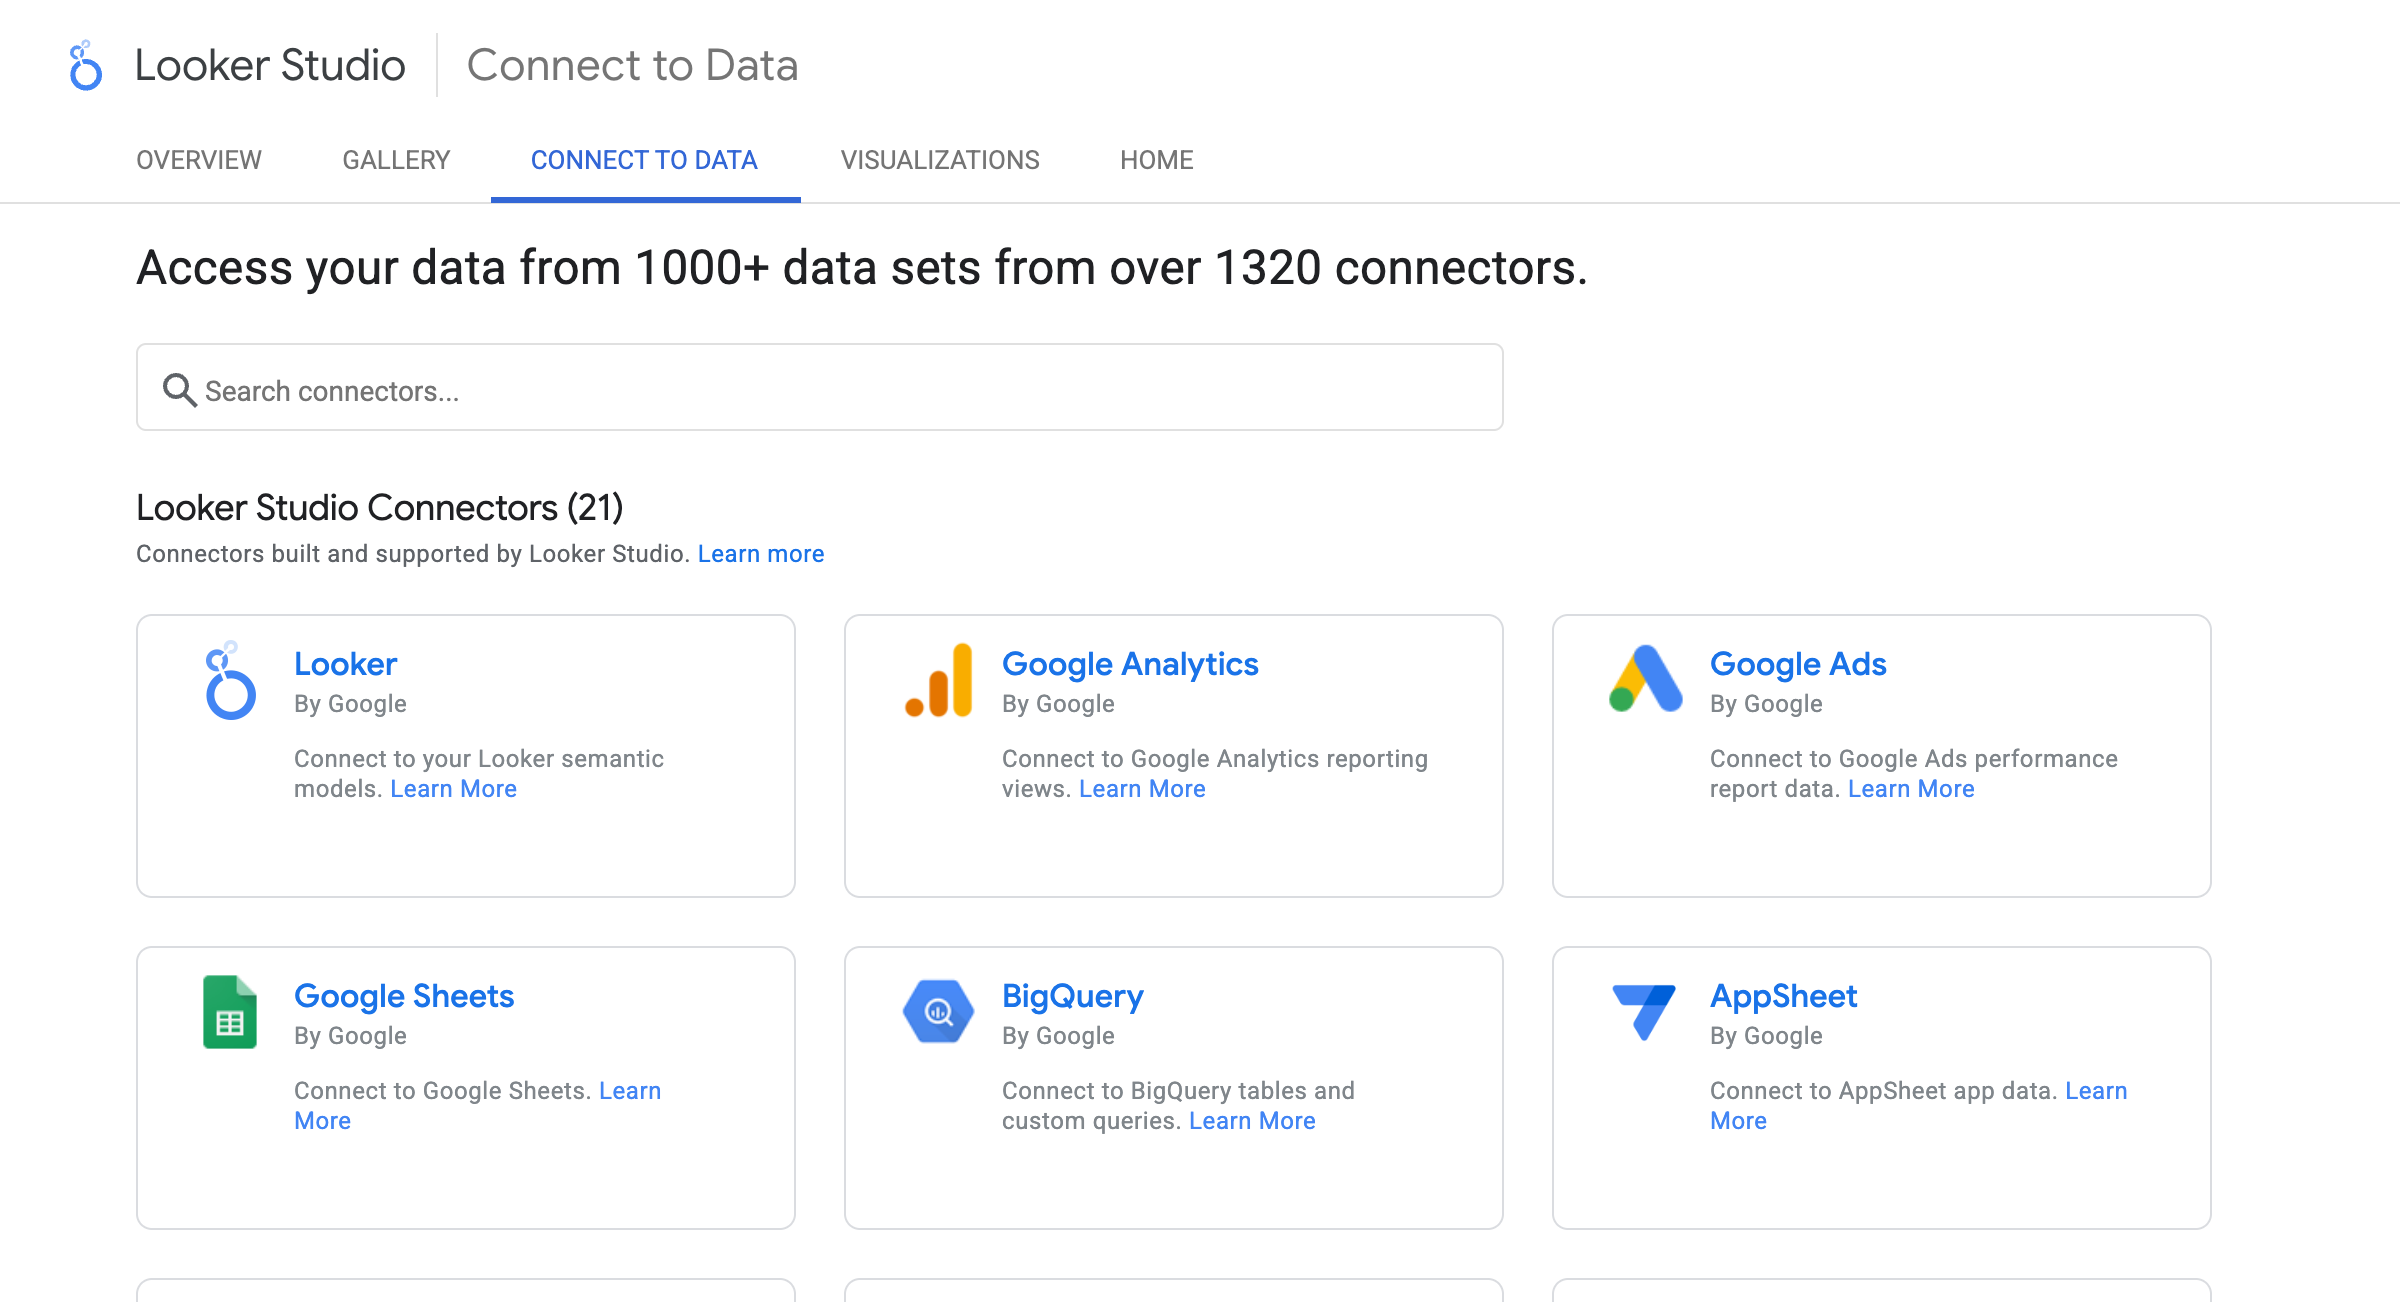
- In the data source selection, search for “BigQuery”
Step 2: Authorize Access
- Click on BigQuery
- If prompted, click Authorize to grant Looker Studio access to your BigQuery data
- You may need to select your Google Cloud project
Step 3: Select Your Data
You’ll see three options:
- My Projects - Your personal GCP projects
- Shared Projects - Projects shared with you
- Public Datasets - Google’s public datasets (great for testing)
Navigate through:
- Select your Project
- Select your Dataset
- Select your Table
- Click Add
Your BigQuery table is now connected! All columns appear as fields in Looker Studio.
Method 2: Custom Query Connection (Recommended for Production)
For production dashboards, I always recommend using custom queries. Here’s why:
- Better performance - Pre-aggregate data in the query
- Lower costs - Reduce data scanned per dashboard load
- More flexibility - Join tables, calculate fields, filter data
- Cleaner data - Transform data before it reaches the dashboard
Step 1: Create a Custom Query Data Source
- In Looker Studio, go to Create → Data Source
- Select BigQuery
- Instead of selecting a table, click Custom Query
- Select your billing project (this is where query costs are charged)
Step 2: Write Your Query
Here’s a template for an optimized dashboard query:
SELECT
  DATE(created_at) AS date,
  product_category,
  region,
  COUNT(*) AS total_orders,
  SUM(order_value) AS total_revenue,
  AVG(order_value) AS avg_order_value,
  COUNT(DISTINCT customer_id) AS unique_customers
FROM
  `your-project.your_dataset.orders`
WHERE
  created_at >= DATE_SUB(CURRENT_DATE(), INTERVAL 90 DAY)
GROUP BY
  date, product_category, region
Why this query is optimized:
- Pre-aggregates data (reduces rows sent to Looker Studio)
- Limits date range (reduces data scanned)
- Groups by dimensions you’ll use in charts
- Calculates metrics at the source
Step 3: Configure the Data Source
- Click Connect in the top right
- Review the detected fields
- Adjust field types if needed:
- Change
dateto Date type - Ensure metrics are set as Number
- Change
- Click Create Report or Done
Method 3: Using Parameters (Advanced)
Parameters let users control query behavior from the dashboard. This is powerful for:
- Dynamic date ranges
- User-selected filters that affect the query
- Conditional logic in SQL
Create a Date Range Parameter
- In your data source, click Add a Parameter
- Configure:
- Name:
start_date - Type: Date
- Default: 30 days ago
- Name:
- Add another for
end_date
Use Parameters in Your Query
SELECT
  DATE(created_at) AS date,
  product_category,
  SUM(order_value) AS total_revenue
FROM
  `your-project.your_dataset.orders`
WHERE
  DATE(created_at) BETWEEN @start_date AND @end_date
GROUP BY
  date, product_category
Connect to Dashboard Controls
- Add a Date Range Control to your dashboard
- In the control settings, link it to your parameters
- Now users can change the date range, and the BigQuery query adjusts
Cost Warning: Parameter-driven queries run fresh each time parameters change. Be mindful of query costs for large datasets.
Performance Optimization Tips
After connecting BigQuery, optimize your setup for speed and cost:
1. Use Partitioned Tables
If your table is partitioned by date, always include a partition filter:
SELECT *
FROM `your-project.your_dataset.orders`
WHERE DATE(created_at) = CURRENT_DATE()  -- Uses partition pruning
2. Pre-Aggregate in Views
Create a BigQuery view for your dashboard:
CREATE OR REPLACE VIEW `your_dataset.dashboard_summary` AS
SELECT
  DATE(created_at) AS date,
  product_category,
  SUM(order_value) AS revenue,
  COUNT(*) AS orders
FROM `your_dataset.orders`
WHERE created_at >= DATE_SUB(CURRENT_DATE(), INTERVAL 365 DAY)
GROUP BY 1, 2
Then connect Looker Studio to the view instead of the raw table.
3. Enable BigQuery BI Engine
For frequently accessed datasets:
- Go to BigQuery console
- Navigate to BI Engine
- Create a reservation for your dataset
- Looker Studio will automatically use BI Engine for faster queries
4. Set Appropriate Data Freshness
- In Looker Studio, click on your data source
- Click the pencil icon to edit
- Find Data freshness settings
- Choose based on your needs:
- 15 minutes - Real-time dashboards
- 1 hour - Regular business dashboards
- 12 hours - Daily reporting
Troubleshooting Common Issues
Issue 1: “Access Denied” Error
Cause: Insufficient BigQuery permissions
Solution:
- Go to GCP Console → IAM
- Find your user/service account
- Add role: BigQuery Data Viewer
- Add role: BigQuery Job User (for custom queries)
Issue 2: Query Runs but No Data Appears
Causes:
- Date filters excluding all data
- NULL values in dimension fields
- Aggregation issues
Solution:
- Test your query in BigQuery console first
- Check for NULL values:
WHERE dimension IS NOT NULL - Verify date formats match
Issue 3: Dashboard is Slow
Causes:
- Querying too much data
- No pre-aggregation
- Large number of distinct values
Solution:
- Add date range filters to your query
- Pre-aggregate data (see optimization tips above)
- Limit dimensions with high cardinality
- Enable BI Engine for your dataset
Issue 4: Costs Are Too High
Cause: Full table scans on every dashboard load
Solution:
- Use partitioned tables with partition filters
- Pre-aggregate data in views
- Increase data freshness interval
- Use BI Engine for caching
Best Practices Summary
Based on 8+ years of building BigQuery dashboards:
| Practice | Why It Matters |
|---|---|
| Use custom queries | Better performance, lower costs |
| Pre-aggregate data | Faster dashboard loads |
| Partition by date | Reduces data scanned |
| Set appropriate freshness | Balances speed vs. cost |
| Use parameters sparingly | Can increase query costs |
| Test queries in console | Catch errors before dashboard |
Cost Estimation
Before connecting large datasets, estimate costs:
-- Check table size
SELECT
  table_id,
  ROUND(size_bytes/1024/1024/1024, 2) AS size_gb
FROM `your_dataset.__TABLES__`
WHERE table_id = 'your_table'
BigQuery pricing (as of 2025):
- $5 per TB queried (on-demand)
- First 1 TB/month free
A 10 GB table queried 100 times/month = ~$5/month
Next Steps
Now that you’ve connected BigQuery to Looker Studio:
- Optimize your queries - Follow the performance tips above
- Add calculated fields - Create custom metrics in Looker Studio
- Build your first chart - Start with simple visualizations
- Set up access controls - Manage who can view your dashboards
Need Expert Help?
Connecting BigQuery to Looker Studio is just the beginning. If you need help with:
- Complex multi-table joins
- Query optimization for large datasets
- Cost reduction strategies
- Building production-ready dashboards
Schedule a free consultation and let’s discuss how to get the most out of your data.
Looking for more BigQuery and Looker Studio tutorials? Check out our guide on Building Your First Looker Studio Dashboard or learn about BigQuery Mistakes That Cost Money.
Related Posts
How to Build Your First Looker Studio Dashboard: Step-by-Step Guide
Learn how to create your first Looker Studio dashboard from scratch. This comprehensive guide covers data connections, chart creation, and best practices for building effective dashboards.
Creating an E-commerce Sales Dashboard in Looker Studio
Build a complete e-commerce sales dashboard in Looker Studio. Track revenue, orders, product performance, and customer insights with this step-by-step guide.
Marketing Attribution Dashboard: Track Campaign ROI in Looker Studio
Build a marketing attribution dashboard in Looker Studio to track campaign ROI, channel performance, and customer acquisition costs. Includes multi-touch attribution models.